Bloch Sphere Demo
The Bloch Sphere demo is an interactive visualization tool that helps users understand how quantum gates affect single-qubit states on the Bloch sphere.
Overview
The Bloch sphere is a geometrical representation of a pure quantum state of a 2-level quantum system (qubit). This demo provides an intuitive way to explore quantum gates and their effects on single-qubit states through visual feedback in your web browser.
Note: The Bloch sphere representation is only applicable to single qubits. For multi-qubit systems, other visualization methods are needed.
Demo Interface
The Grok Bloch demo provides an interactive web interface where you can:
- View the Bloch sphere representation in 3D
- See the current quantum state equation at the top
- Click gate buttons (X, Y, Z, S, T, H, etc.) to apply transformations
- Choose rotation angles (θ=π/8 or θ=π/12) for rotation gates
- Watch the Bloch vector move in real-time
- Monitor the probability of measuring |0⟩
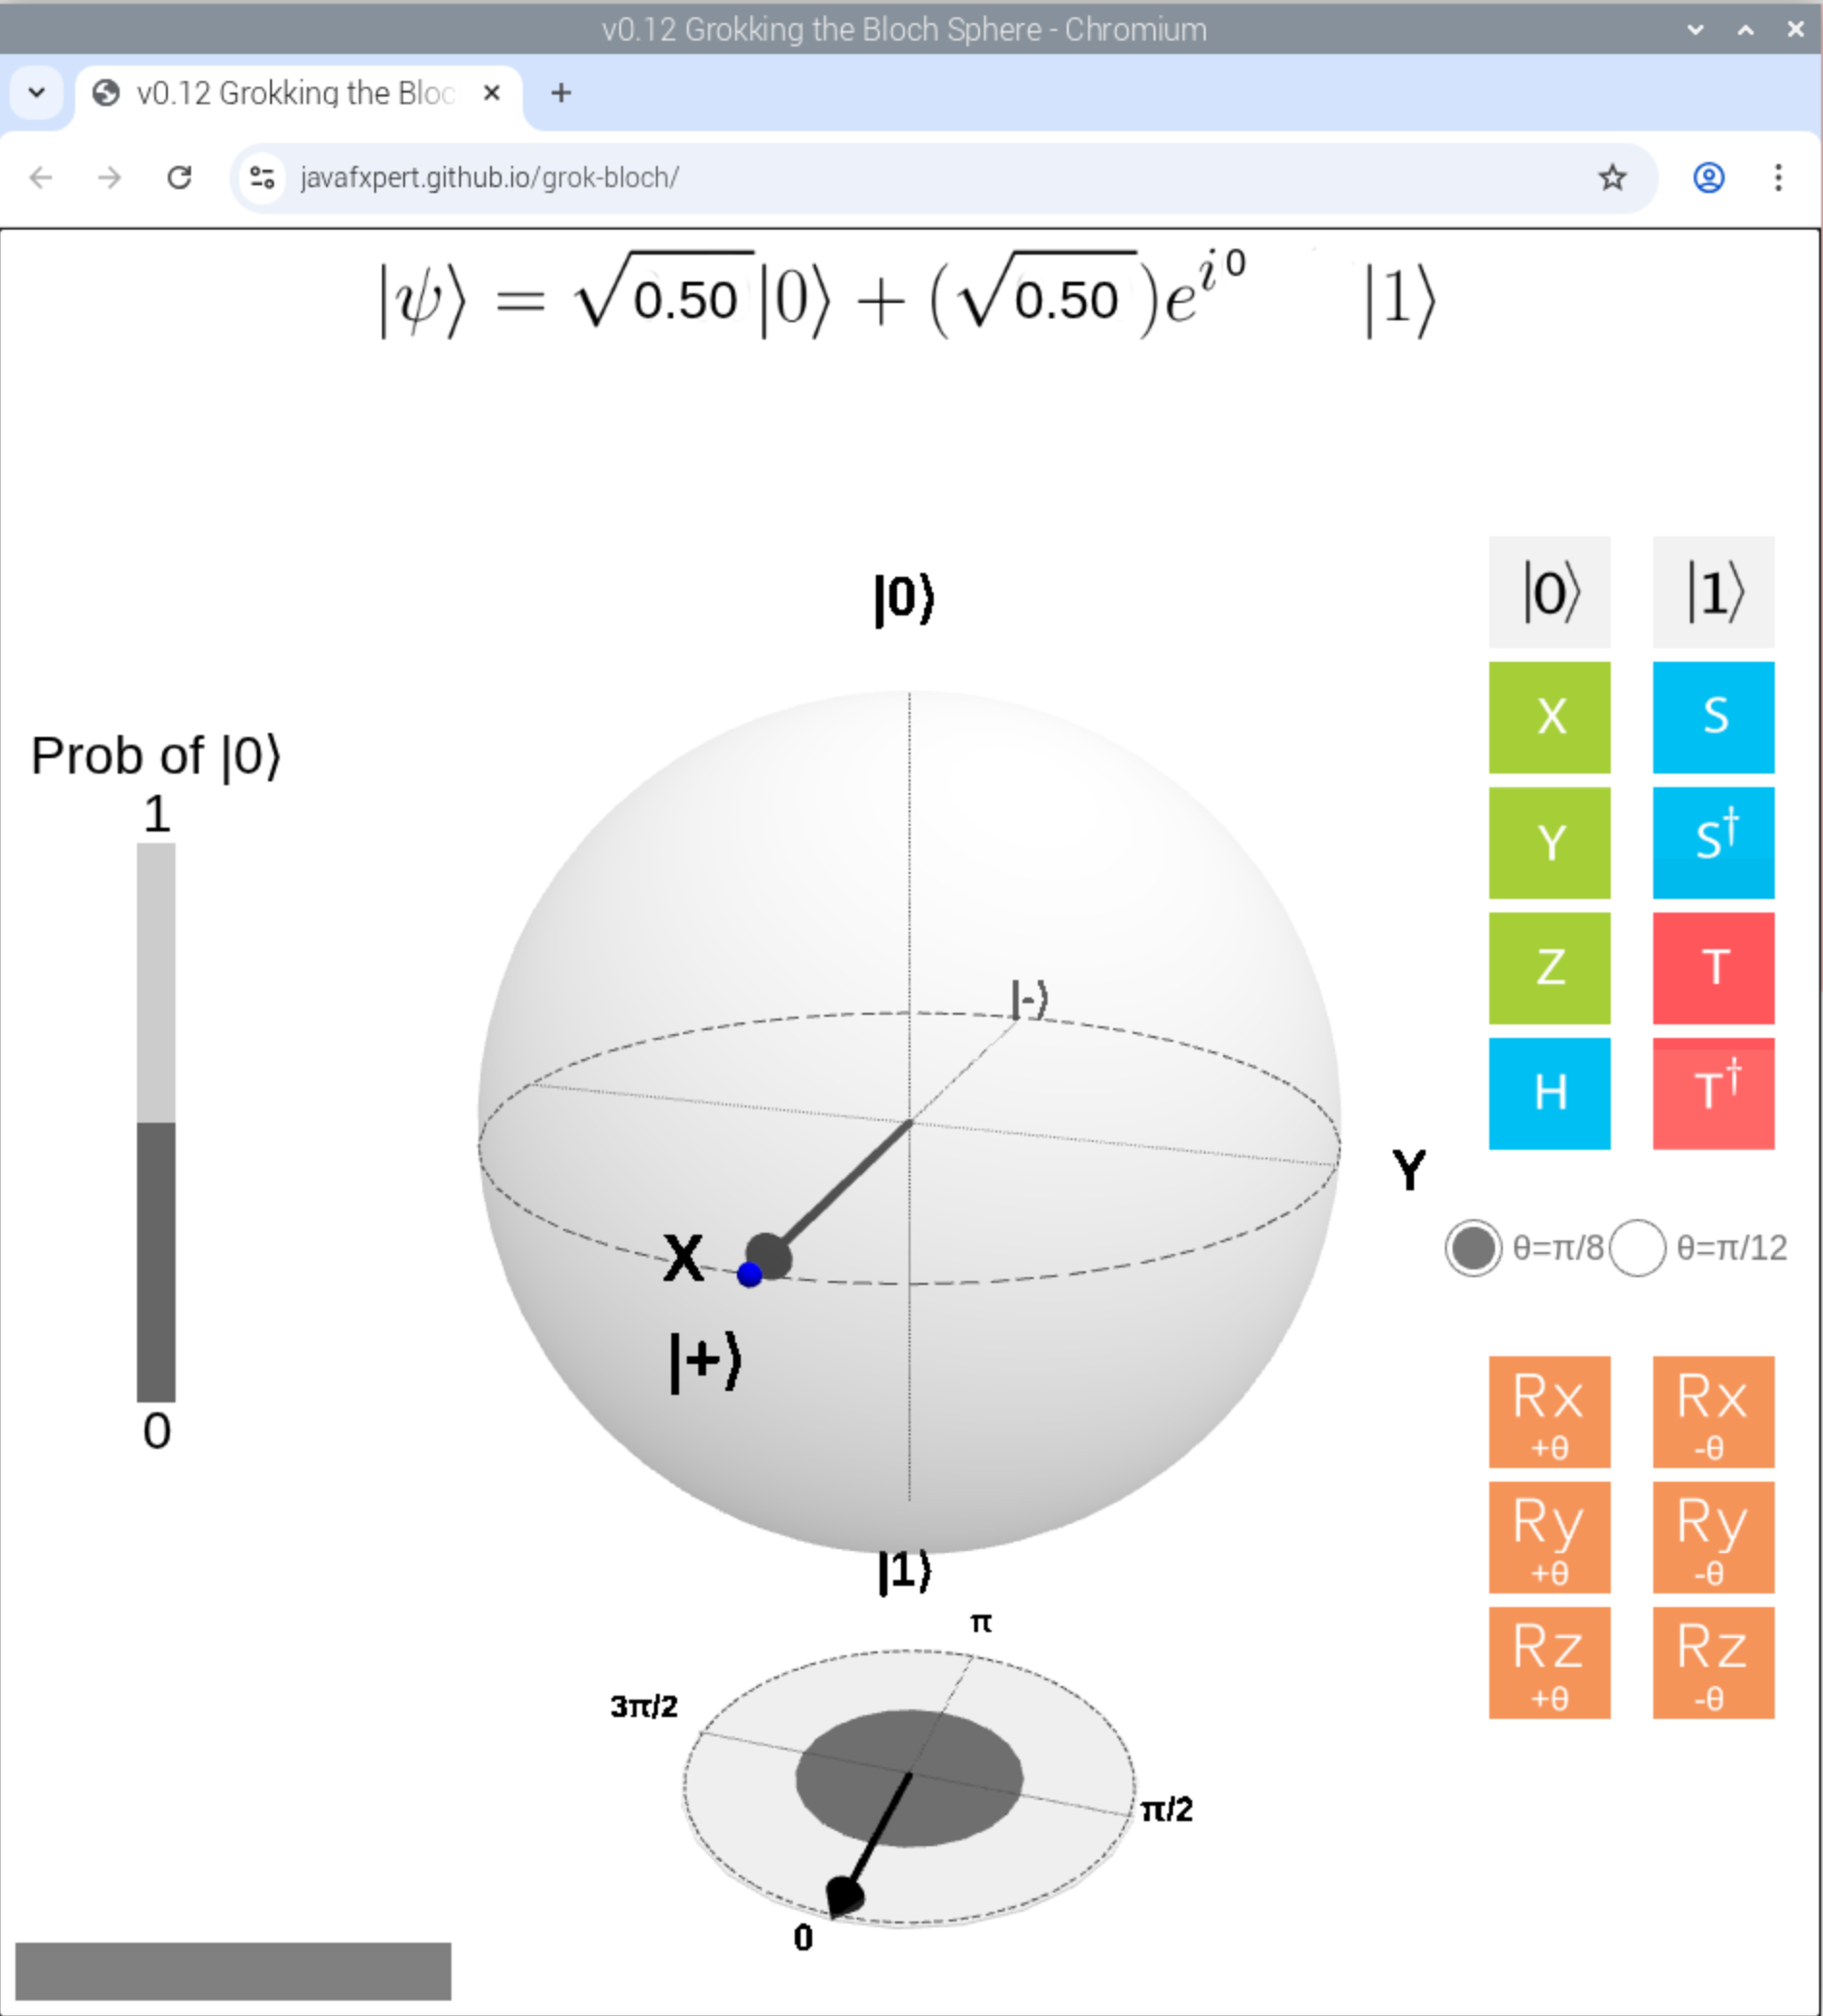 The interactive Grok Bloch interface showing the Bloch sphere, quantum state, and gate controls
Features
- Interactive Visualization: See how quantum gates transform qubit states in real-time
- Educational Tool: Perfect for understanding fundamental single-qubit quantum concepts
- Web-Based Interface: Runs in your browser for easy access
- Gate Operations: Apply common quantum gates (Pauli-X, Y, Z, Hadamard, rotations)
- Real-Time Updates: Watch the Bloch vector move as you apply gates
What You'll Learn
- Quantum State Representation: How single qubits are represented on the Bloch sphere
- Gate Operations: Visual understanding of how gates transform states
- Superposition: See how qubits exist in multiple states simultaneously
- Phase: Understand the role of quantum phase in single-qubit operations
Running the Demo
Preferred Method: Desktop Icon
- Look for the "Grok Bloch" icon on your RasQberry desktop
- Double-click to launch the demo
- Your default web browser will open with the interactive visualization
Alternative: Desktop Menu
- Click on the desktop menu
- Navigate to: Applications → RasQberry → Grok Bloch
- The demo will launch in your browser
Command Line (Advanced)
cd ~/RasQberry-Two
source venv/RQB2/bin/activate
cd demos/grok-bloch
python3 grok_bloch.py
Understanding the Visualization
The Bloch sphere represents a single qubit's state as a point on a unit sphere:
- North Pole (top): |0⟩ state
- South Pole (bottom): |1⟩ state
- Equator: Superposition states with equal probabilities
- X-axis: |+⟩ and |-⟩ states (Hadamard basis)
- Y-axis: |+i⟩ and |-i⟩ states (circular basis)
Any point on the sphere represents a valid pure quantum state of a single qubit.
Quantum Gates Demonstrated
Pauli Gates
- X Gate (NOT gate): Rotates around X-axis by π (flips |0⟩ ↔ |1⟩)
- Y Gate: Rotates around Y-axis by π
- Z Gate (Phase flip): Rotates around Z-axis by π (adds phase)
Hadamard Gate
Creates equal superposition: transforms |0⟩ to (|0⟩ + |1⟩)/√2
Rotation Gates
- Rx(θ): Rotation around X-axis by angle θ
- Ry(θ): Rotation around Y-axis by angle θ
- Rz(θ): Rotation around Z-axis by angle θ
Hardware Requirements
- Raspberry Pi (Pi 5 recommended, Pi 4 supported)
- Display (monitor or VNC connection)
- Web browser (Chromium included in RasQberry)
- Mouse/keyboard or touchscreen for interaction
Tips
- Start Simple: Begin with basic gates (X, Z, H) before trying rotation gates
- Observe Patterns: Notice how different gates affect the Bloch vector direction
- Combine Gates: Apply multiple gates sequentially to see composite effects
- Reset State: Use the reset button to return to |0⟩ state
- Experiment: Try to reach specific target states by combining gates
Educational Context
This demo is excellent for:
- Introduction to Quantum Computing: First visualization of quantum states
- University Courses: Teaching quantum mechanics and single-qubit operations
- Workshops: Interactive demonstrations at quantum computing events
- Self-Learning: Exploring quantum concepts at your own pace
- Gate Intuition: Building mental models for quantum gate operations
Limitations
- Single Qubit Only: The Bloch sphere cannot represent multi-qubit states or entanglement
- Pure States: Only represents pure states, not mixed states (density matrices)
- Classical Visualization: A classical 3D visualization of quantum phenomena
Credits
Developed by James Weaver (JavaFXpert)
- Repository: JavaFXpert/grok-bloch
- Purpose: Educational visualization of single-qubit quantum states
Learn More
IBM Quantum Resources
- IBM Quantum Learning: Single-Qubit Gates
- IBM Quantum Composer - Build circuits with visual Bloch sphere
Qiskit Documentation
General Resources
Troubleshooting
Demo won't start
- Ensure virtual environment is activated
- Check that dependencies are installed:
pip list | grep qiskit - Verify Python version:
python3 --version(should be 3.9+)
Browser doesn't open
- Open manually and navigate to:
http://localhost:5000 - Check firewall settings
- Try a different browser (Firefox, Chromium)
Visualization not loading
- Check console for errors (F12 in browser)
- Ensure Python server is running in the background
- Restart the demo
- Check that no other service is using port 5000
Port already in use
# Find and kill process using port 5000
lsof -ti:5000 | xargs kill -9
Related Demos
- Raspberry Tie - Run quantum circuits with LED visualization
- Quantum Lights Out - Quantum puzzle solving
- Qoffee Maker - Quantum coffee selection
- Demo List - All available demos
IBM Quantum and Qiskit are trademarks of IBM Corporation. This demo uses open-source Qiskit software.